1.Logarithmic
16.01.2021
Contents/Index
@1. Logarithmic2. Absoulte Value
3. The Square Root
The logarithmic function is taking the logarithm of the $x$ with respect to some base. Here we just use the natural logarithm. Denote it $ln$. We can change base from $a$ to $b$ with the following formula: $$ log_b(x) = \frac{log_a(x)}{log_a(b)} $$
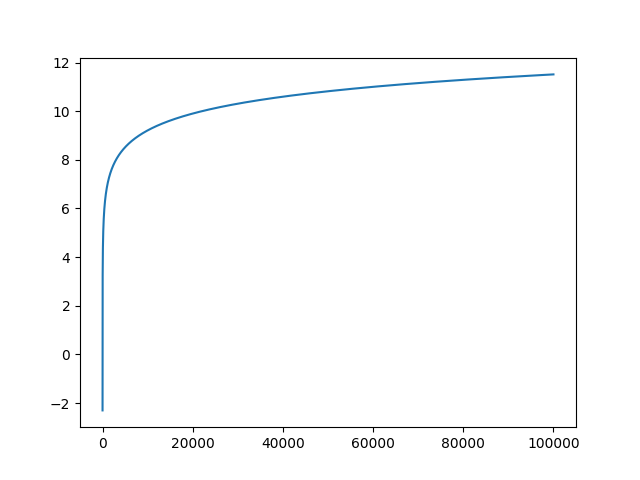
The function is the inverse to the exponential function in the same base. That is $$ ln(e^x) = x $$ The function is defined on $[1,\infty]$. The function is monotonically increasing meaning that $$ x_1 \leq x_2 \Rightarrow f(x_1) \leq f(x_2) $$ We can plot the function with the following python3 code:
import numpy as np import matplotlib.pyplot as plt def f(x): return np.log(x) x = [float(x) / 10.0 for x in range(1,10 ** 6)] y = [f(x) for x in x] plt.plot(x,y) plt.show()For which we get the plot in Figure 1.
The function has the derivative $$ ln(x)' = \frac{1}{x} $$ It is commonly used in different statistical settings since it is monotonical and has a simple derivative. Hence we know that we can apply it to a set of numbers while we still preserve the order of them.